Posted by Vitor Gaspar, John Ralyea, and Majdeline El Rayess[1]
Public sector balance sheets provide the most comprehensive picture of public wealth, looking beyond simply debt and deficits, bringing into the picture not only what governments owe but also what they own.
As highlighted in the October 2018 Fiscal Monitor, using the public sector balance sheet in fiscal policy analysis can lead to better asset management and risk assessment, much improved fiscal transparency, and a richer insight into the beneficial role fiscal policy can play in economic development. And keeping an eye on public sector net worth – a component of balance sheet analysis – is a good idea, as it has implications for the cost of government financing and economic outcomes.
This blog is about Indonesia’s public sector balance sheet and its use for policy purposes. As documented in the recent book “Realizing Indonesia’s Economic Potential” published by the International Monetary Fund, Indonesia has made remarkable political, economic, and social progress during the past two decades. Important economic reforms have created a more market-based and resilient economy. But critical development challenges remain. The World Bank has estimated Indonesia loses around 1 percentage point of GDP growth a year due to inadequate infrastructure. The authorities are not standing still. To address the investment shortfall, they have announced an ambitious public infrastructure development plan equivalent to 32 percent of GDP, funded partly by higher tax revenue.
Is the use of tax revenue to finance infrastructure investment a good idea? How would such a policy effect Indonesia’s public sector wealth? Are there better options? Some of us have put out an IMF Working Paper that applies the public sector balance sheet approach to fiscal policy analysis to answer these questions.
Indonesia’s public sector balance sheet
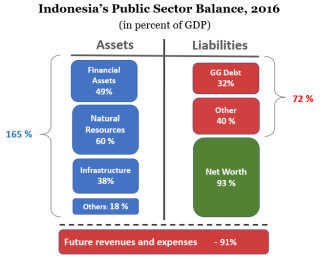
To apply the balance sheet approach, it is important to have a good understanding of Indonesia’s public sector balance sheet. In 2016, public sector assets were close to 165 percent of GDP, with natural resource reserves of oil, coal, and other minerals the largest component. Financial assets and public infrastructure assets such as the stock of roads, railways, schools, and ports are also significant (Figure 1).
Indonesia’s public sector liabilities amount to 73 percent of GDP, less than its assets. The best-known public sector liability is general government debt. However, the public sector has other obligations too, which do not enter in standard fiscal policy analysis. In Indonesia’s case these liabilities are equivalent to about 40 percent of GDP — larger than government debt. Currency and deposit obligations of Indonesia’s public-sector banks comprise the lion’s share of these obligations.
The difference between public sector assets and liabilities yields a public sector net worth of about 93 percent of GDP in 2016. While Indonesia’s net worth is quite large compared to other countries, a word of caution is necessary. Non-financial assets such as natural resources and infrastructure comprise a significant portion of Indonesia’s public sector assets. These assets are typically illiquid, and their valuation involves a degree of uncertainty. Indonesia’s financial net worth, a more conservative indicator, is considerably less robust at a negative 23 percent of GDP.
To get a sense of how well placed Indonesia’s balance sheet is to meet future pressures, we project the balance sheet forward to look at the country’s intertemporal public wealth. For this, we estimate the net present value of future government revenues and expenses – taking account of projected demographic developments. For Indonesia, these projected future flows amount to negative 91 percent of 2016 GDP, as future expenditures exceed future revenues. Combining these future flows with current net worth shows Indonesia’s intertemporal public wealth close to zero (at about 2 percent of GDP in 2016).
Policy analysis
With Indonesia’s balance sheet in hand, we can now assess the impact of a tax-financed public investment strategy on public wealth. To do so, we use an economic model to simulate the effects the strategy on Indonesia’s economy. The model results underlie the projections of the evolution of Indonesia’s public sector balance sheet and, hence, its intertemporal public wealth.
So, what does the balance sheet approach tell us? While the tax increase to finance public investment dampens economic activity, this effect is more than offset by higher investment, both through the immediate demand effect, and the longer run benefit of a larger capital stock.
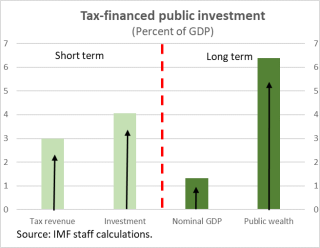
In the short run, the level of Indonesia’s real GDP increases by 2¾ percent. The higher investment also boosts Indonesia’s public capital stock and public wealth by four percentage points of GDP (Figure 2). The positive impact continues over the long term. The larger capital stock increases the level of long-run real and potential GDP by 1⅓ percent. This permanently higher output level leads to continuous, albeit modest, improvements in the budget balance. Combined with the increase in the public capital stock, the total increase in intertemporal public wealth from this tax-financed public investment policy is about 6½ percent of GDP.
Assessing other policy options
Our analysis is further enriched by making alternative assumptions. For example, if the Indonesia authorities undertake reforms to improve the efficiency of investment spending, output and public wealth would increase even further. In the extreme case of perfect efficiency – every rupiah spent on investment increases the public capital stock by the same amount – the level of long run GDP would be more than 2 percent higher and intertemporal public wealth would increase by almost 10 percent of GDP. Alternatively, debt financed infrastructure investment generates a smaller increase in public sector net worth relative to the tax-financed scenario.
In conclusion, public sector balance sheet analysis in Indonesia brings out the gains to public wealth from tax-financed public investment more clearly than standard fiscal analysis based on debt and deficits could have done. More broadly, it provides a comprehensive and transparent picture of the entirety of the public sector’s finances. If you want to learn more, we encourage you to read the working paper (link here).
[1] Vitor Gaspar is the Director of the IMF’s Fiscal Affairs Department (FAD). John Ralyea is a Senior Economist and Majdeline El Rayess is an Economist in FAD.
Note: The posts on the IMF PFM Blog should not be reported as representing the views of the IMF. The views expressed are those of the authors and do not necessarily represent those of the IMF or IMF policy.


