During the 2008 financial crisis, the UK government was, to some extent, ‘flying blind’, given the inability of official economic statistics to keep pace with the unfolding crisis. During the Covid-19 pandemic, it was able to supplement these data with novel real-time indicators (RTIs) such as consumer card spending, or online job vacancies data.
This article reviews the UK’s experience in using RTIs to inform economic policy-making during the pandemic, with a view to distilling some lessons for future use.
What are RTIs?
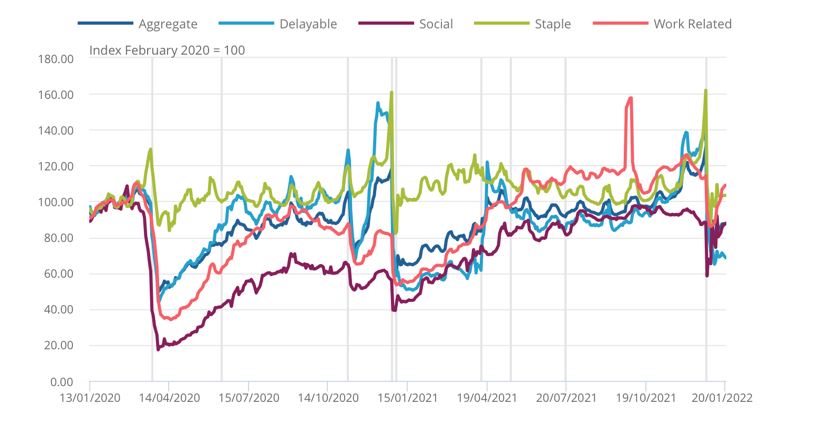
RTIs are data that are updated with a high frequency and can provide early insights where traditional statistics are not yet available. Opportunities to create RTIs have exploded in the digital age, moving beyond the use of data explicitly collected for measurement purposes (e.g., surveys) and taking advantage of data collected incidentally about agents’ behaviour. Such information includes administrative tax data, google searches, or credit or debit card purchases (see chart below). These data can offer greater granularity than aggregated national statistics.
Aggregate CHAPS-based indicators of credit and debit card purchases, non-seasonally adjusted, nominal prices
Officials must weigh trade-offs carefully in using RTIs. Some issues to consider include:
- There is a dizzyingly large number of datasets available, but ingesting and cleaning them is time-intensive, so officials must prioritise which data to focus on;
- Officials must also account for technical barriers (e.g., IT restrictions or significant data cleaning), legal restrictions (with sensitive data) or the cost of acquiring privately-owned data;
- Weighing the need for faster data against the inherent volatility of many RTIs;
- Data collection and cleaning failures (such as web-scraping failure due to a website layout change) that are not immediately picked up and require subsequent revisions to the data;
- Using insights from RTIs, while keeping in mind they are complements, and not substitutes, for official statistics which go through more thorough testing;
- Issues of data ethics (such as breaches to data privacy).
Building blocks
The ability to deploy RTIs during the Covid-19 pandemic did not develop overnight, but relied on a prior build-up of skills, infrastructure, as well as legal frameworks and processes.
- Skills
The creation of the Government Digital Service (GDS) in 2011 led to the recruitment of digital professionals. Similarly, the creation of the ONS Data Science Campus in 2017 spearheaded the expansion of the data science profession across government. Additionally, the government leaned on a wider data science ecosystem, such as Imperial College London and the Turing Institute, for additional expertise.
The UK’s experience reflects the importance of early, sustained efforts to build the skillset necessary to rapidly exploit data in emergency situations. That said, staff with a good understanding of data issues, let alone serious data science skills, is still limited in the civil service. Moreover, its structures and incentives tend to promote high staff mobility and turnover, and favour generalists for promotion.
- Infrastructure
Developing RTIs requires access to large volumes of data and the tools necessary to analyse information. This implies having automated processes to ingest and clean data to make it useable, which is time-consuming and can be a major hurdle in a time of crisis. It also requires access to cloud infrastructure alongside modern software tools like Python, R or SQL.
While the civil service has made progress in adopting such tools, significant amounts of government data are still saved and shared in unsuitable formats, creating a plethora of inconsistently formatted Excel, CSV, Word or PDF files from which it may be challenging to extract relevant data.
Linking data across government can create additional value. ‘Government as a Platform’ was central to the thinking underpinning the UK government’s digitalisation initiatives, implying smoothly connected datasets across departments. Some efforts paid off during the pandemic, such as the Department for Work and Pensions’ APIs which helped other departments query its data to identify vulnerable individuals and businesses. Most government departments, however, still run systems separately and lack the shared infrastructure to smoothly collaborate and link their data with other parts of government.
- Legal frameworks and processes
Regulations and processes are needed to allow data to be accessed and shared, while protecting sensitive information. Progress has been partial, as data-sharing processes are not systematic and continue to hinder collaboration, despite an attempt to improve administrative data-sharing through the Digital Economy Act (2017).
In a context of regulatory uncertainty around data-sharing, risk aversion by officials can create further difficulties in sharing data, although this tendency abated during the pandemic as emergency responses took priority. Government statisticians also displayed greater reactivity and willingness to accept risk in publishing novel statistical indicators which underwent less testing than is typically required.
Main lessons
- Governments can act rapidly and flexibly to develop innovative RTIs.
- This requires prior, sustained efforts to develop the necessary data skills, infrastructure and data-sharing processes.
- RTIs can supplement but not replace official statistics: further work is needed to understand their quality and predictive power.